- 首页
- Product
- Case
- Fabrication
-
Video
- News
- About Us
-


-

-
 中溯平台登录
Analysis of the Printing Industry's Operational Performance for the First Seven Months of 2023 2023-10-31 11:06:43
Recently, the National Bureau of Statistics disclosed the economic benefits of industrial enterprises from January to July 2023. In July, although the monthly growth rate of industrial production decreased compared to the previous month, the cumulative growth rate remained basically stable.
It should be noted that in the statistical system of the National Bureau of Statistics, the "printing and recording media replication industry" is one of the 41 major industries in the entire industry. More than 6000 enterprises above the designated size (with an annual main business income of over 20 million yuan) report operating data on a monthly basis. The total annual operating income of these enterprises is over 700 billion yuan, accounting for more than half of the overall revenue scale of the printing industry in China.
Based on this, the operational performance of printing enterprises above designated size has become an important window for observing the development status of the entire industry. The Science and Technology Printing Media Industry Research Center will also use this representative observation window to timely disclose statistical data every month, analyze industry changes and dynamics, help industry practitioners clarify development trends, and adjust business strategies in a timely manner.
1. Overall trend analysis
From January to July 2023, the industrial added value of all industries (enterprises above designated size) increased by 3.8% year-on-year, unchanged from the previous month. From the growth rate of that month, Figure 1 shows that the industrial added value of all industries (enterprises above designated size) increased by 3.7% year-on-year in July, a decrease of 0.7 percentage points compared to the previous month. In terms of industries, 23 out of 41 major industries maintained year-on-year growth in added value, with a growth rate of just over 50%.
In July, the growth rate of industrial added value of printing enterprises on the scale was -5.2%, which has narrowed compared to the slowdown last month. Compared to the average growth rate of all industries, the printing industry is in a weak trend.

图1 GDP、全部工业及印刷业增加值同比增速
2. Revenue and Profit Analysis
From January to July 2023, enterprises above designated size in the printing industry achieved operating revenue, a year-on-year decrease of 6.6%, which is consistent with the previous month (see Figure 2). During the same period, all industrial enterprises above designated size achieved operating revenue, a year-on-year decrease of 0.5%, compared to -0.4% from January to June, and the growth rate continued to decline. Since the beginning of this year, the revenue growth rate of printing industry enterprises has been operating in a negative growth range, which is significantly lower than the average level of all industries, indicating a weak industry prosperity.
From January to July 2023, enterprises above designated size in the printing industry achieved a total profit, a year-on-year decrease of 11.5%. Compared to -13.6% from January to June, the decrease narrowed by 2.1 percentage points. From the operating trend this year, the cumulative profit decline has continuously narrowed since the beginning of the year, and the profit pressure on printing enterprises has eased.
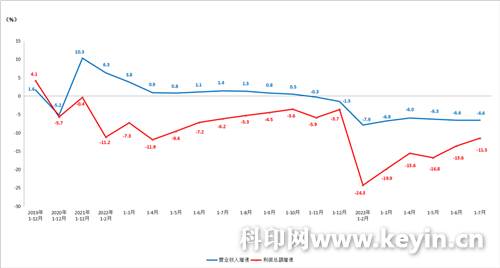
图2 印刷业累计营业收入与利润总额同比增速
Compared to the paper industry closely related to the printing industry, the revenue growth rate of the paper and paper products industry from January to July was -5.1%; The growth rate of total profit is -46.1%, which has expanded compared to the decrease in profit last month.
3. Benefit analysis
In July 2023, the loss area of enterprises above designated size in the printing industry was 28.4%, a decrease of 1.4 percentage points compared to the previous month; The total losses of loss-making enterprises increased by 16.3%. Figure 3 shows the loss profile of each month since 2021. It is evident that although the loss profile has been decreasing since the beginning of this year, compared to the same period last year, the loss profile of designated printing enterprises has significantly improved.
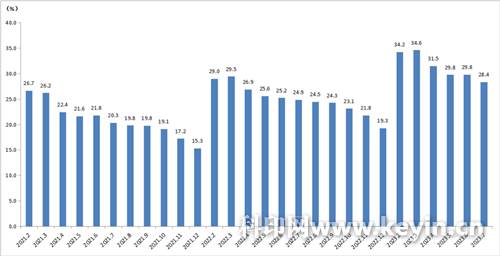
图3 印刷业亏损面
From January to July 2023, the operating revenue profit margin of printing scale enterprises was 4.46%, which continued to increase compared to the previous month. However, as shown in Figure 4, there was a decrease of 0.4 percentage points compared to 4.89% in the same period last year. Compared to the average level of 5.39% in all industries from January to July, there is a significant gap. How to increase revenue and profits is still a difficult proposition for Indian companies this year.
From January to July 2023, the cost per 100 yuan of operating revenue in the printing industry was 84.14 yuan, which continued to decrease compared to the previous month. This number is lower than the average level of 85.22 yuan for all industries, and has also decreased compared to 84.76 yuan for the printing industry in the same period last year. This year, the low price of paper has reduced the cost pressure on printing enterprises, which has contributed to the overall improvement of unit costs.
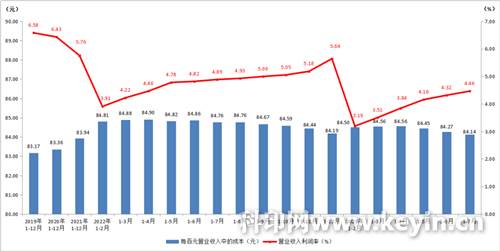
图4 印刷业累计营业收入利润率与每百元营业收入中的成本
4. Asset quality analysis
At the end of July 2023, the asset liability ratio of enterprises above designated size in the printing industry was 46.59%. Compared to 46.50% last month, there has been an increase. Compared with the asset liability ratio of 57.6% for all industries at the end of July, the overall debt level of printing enterprises is relatively low.
At the end of July, the average payback period for accounts receivable of enterprises above designated size in the printing industry was 69.14 days, an increase from 69.04 days last month. Compared to 58.45 days in the same period last year, there was an increase of 10.69 days, indicating a significant increase in the pressure on printing companies to occupy funds this year compared to last year.
At the end of July, the turnover days of finished product inventory for enterprises above designated size in the printing industry were 20.72 days, which was the same as last month, but increased by 2.68 days compared to the same period last year, and the inventory turnover speed slowed down.
5. Analysis of export delivery value
From January to July 2023, the export delivery value of the printing industry decreased by 8.1% year-on-year (see Figure 5). From the month of July, the export delivery value was 5.05 billion yuan, a year-on-year decrease of 12.6%, marking the largest slowdown in various months of this year. The continuous impact of the global manufacturing downturn and contraction of external demand is also fully evident in the printing industry.
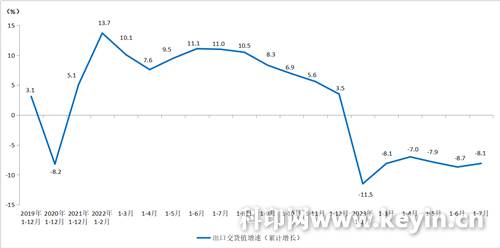
图5 印刷业出口交货值增速
6. Price Index Analysis
By using the Producer Factory Price Index, the market price dynamics of various industries can be observed.
Figure 6 shows the monthly price trends since 2020. As of July, pulp prices (green line) continued to bottom out, driving paper prices (blue line) to continue to decline, and the decline has not yet stabilized.
Compared to the fluctuations in paper prices, the printing price index (red line) has remained stable and slightly declined; The price index (yellow line) of binding and printing related services has entered a new round of parity cycle since May when there was a change.
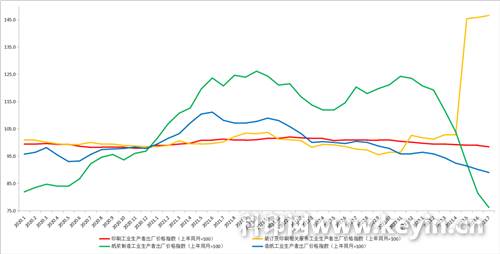
图6 部分行业生产者出厂价格指数(上年同月=100)
7. Analysis of Some Industry Trends
Table 1 shows the growth of main business income in some of the 41 major industries that are closely related to the printing industry. Most of these industries are customer industries served by the printing industry, as well as upstream industries such as paper making.
As shown in the table, the average growth rate of all industrial main business income from January to July 2023 was -0.5%, continuing a slight decline trend.
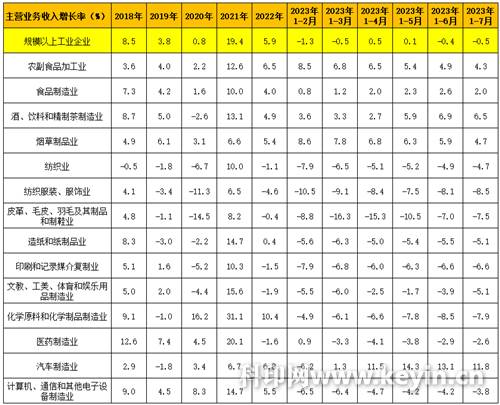
表1 部分行业主营业务收入增长率
In terms of industries, the basic consumer goods industries, such as agricultural and sideline food, food manufacturing, alcoholic beverages, refined tea, tobacco, etc., are all in a positive growth range, with varying growth rates; Other consumer goods industries, such as textiles, clothing and apparel, leather shoes, and industrial beauty sports, are relatively sluggish and still in a negative growth range. In the industrial product industry, automobiles have entered the off-season of sales, with a slight decrease in growth rate, but the growth rate is still quite impressive, playing a strong driving role; The chemical, computer communication, and other electronic equipment manufacturing industries are still experiencing negative growth rates.
Overall, since the beginning of this year, China's economy has gradually emerged from the impact of the epidemic and continued to recover towards a positive trend. However, under the influence of multiple negative factors such as sustained inflation, financial market turbulence, rising debt pressure, and geopolitical tensions, the world economy is still facing downward pressure. The domestic economic recovery also faces constraints such as insufficient demand, structural contradictions, and cyclical issues intertwined. Faced with various pressures, printing enterprises still need to strengthen their confidence, hold onto their own business, actively accumulate development momentum, and walk the path of stable development in the era of major changes.
Source: Keyin Network
2024年5月24日,我司长期战略合作伙伴广东省九江酒厂有限公司领导一行莅临众能科技园进行参观交流。本次参观交流不仅进一步增加对珠海众能印刷有限公司了解,更是双方深化多元合作、共同探索未来合作新模式的重要起点。公司总裁许伯生先生和销售一部车总监对九江酒厂领导们的到访表示热烈欢迎,并感谢九江酒厂长期以来在工作
产学研合作-华中科技大学2023年2月7日,华中科技大学、国家防伪工程技术研究中心尤新革主任莅临公司指导工作。公司总裁许伯生先生、副总裁杨振杰先生,研发中心总监刘海清先生等对尤主任到访表示热烈欢迎同时对华中科技大学给予的长期支持表示深深的感谢。华中科技大学与众
01行业数据012023全球包装印刷市场规模达4405亿美元Reportlinker发布的《2023全球包装印刷市场》报告显示,全球包装印刷市场从2022年的4122.7亿美元增长到2023 年的4405亿美元,复合年增长率为6.8%。受俄乌冲突的影响,商品价格飙升、供应链中断造成商品和服务的通货膨胀,影响了全球许多市场。预计到2027年,包装印刷市场将
 联系手机:19966308713
 座机号码:0760-86630003
 business@joinet.com.cn
 微信咨询
微信咨询

